


A spring day on the grid
A spring day on the grid
Where does electricity come from when load is at its lowest in the US?

Opportunities to make money are often a matter of following what has been successful elsewhere and making it happen locally. With this in mind, I decided it was time to dive into the data from Regional Transmission Operators (RTO) and Independent System Operators (ISO) in the US. This is a dive into April 21 2024 to look at the generation mix from each of these operators. As a spring Sunday in the United States, industry impact and heating and cooling needs are minimized. This means what we’re seeing is close to the minimum fossil fuel generation, depending a bit on the weather in each region. My goal is to see which regions have low-hanging fruit for wind and solar build-out and speculate as to why that fruit hasn’t been picked. I’d love to hear from you if you like these more chart-heavy articles, so respond to the poll question at the end!
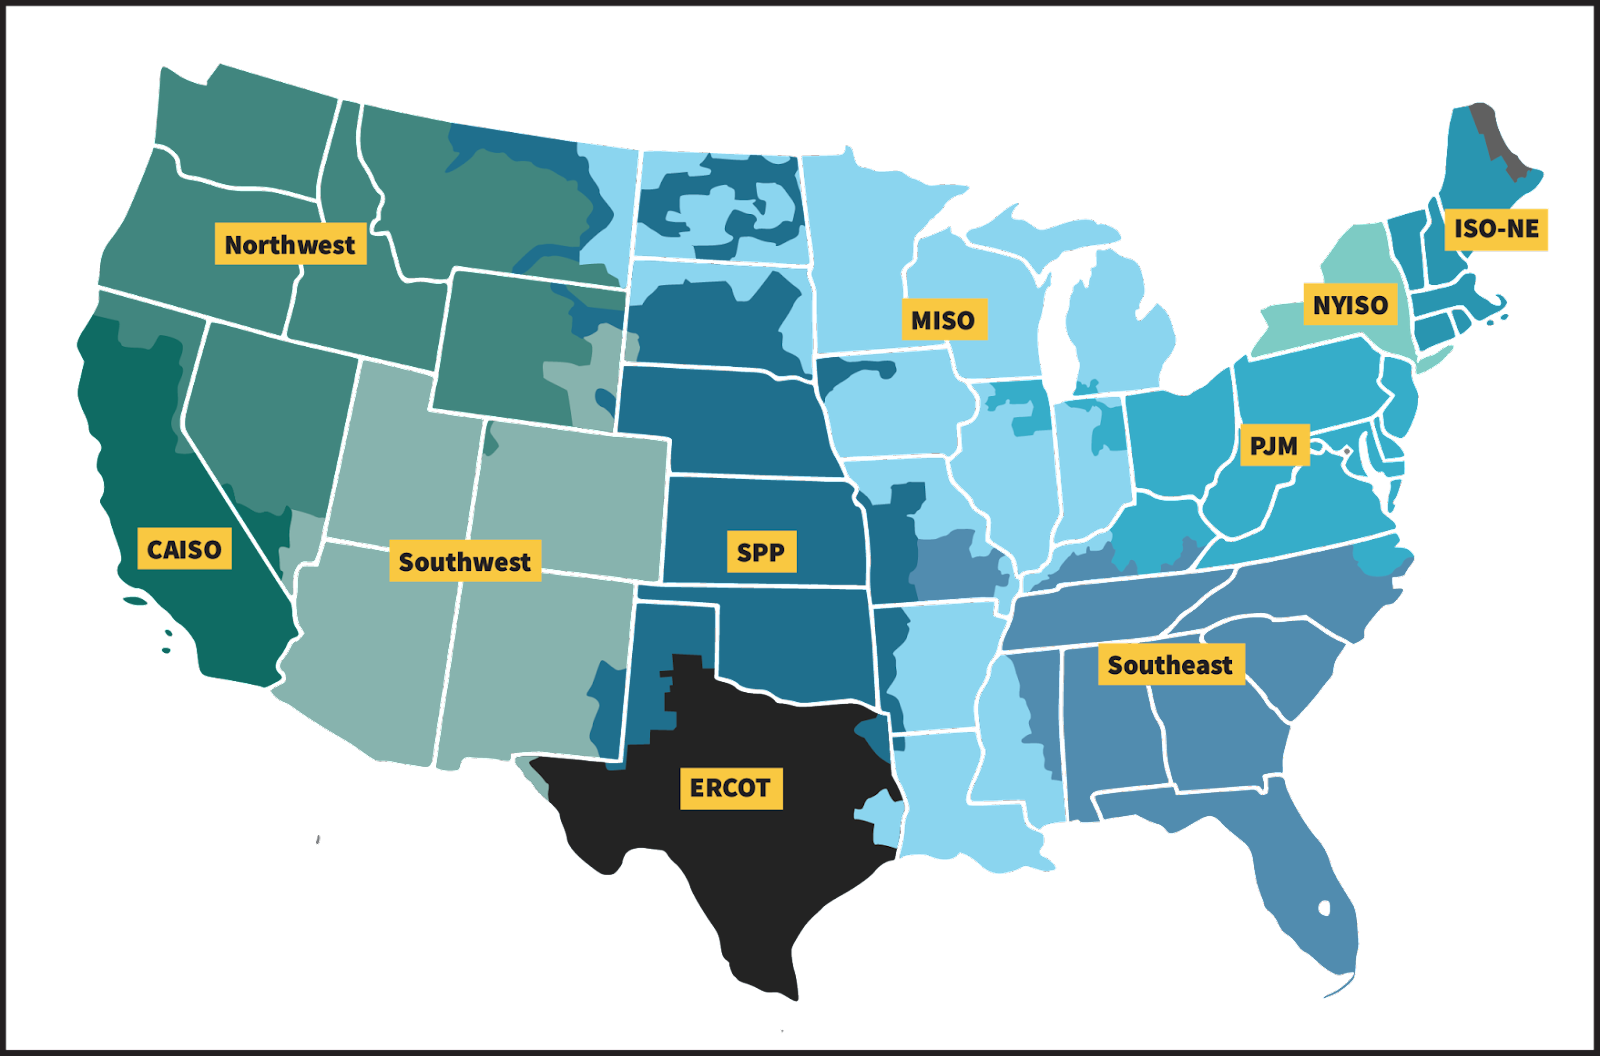
One of the benefits of electricity markets versus the integrated utility model is the open access to data. When there is a market for purchasing power, the details about the power must be disclosed so that buyers can make informed decisions. This also lets us understand which generation types are thriving in each market across the US. It would be great if regulators required vertically integrated utilities to disclose the same level of detail, but I digress. Here is the map of where RTOs and ISOs exist across the US from the FERC website. Northwest, Southwest, and Southeast are all regions with vertically integrated utilities so I don’t present any data from those regions as it isn’t consistently available.
Texas and California move into batteries
ERCOT (Texas) and CAISO (California) lead the way in the US on renewable energy. I suspect this is why each of them proudly make available information on their fuel mix over time in lovely charts like these.
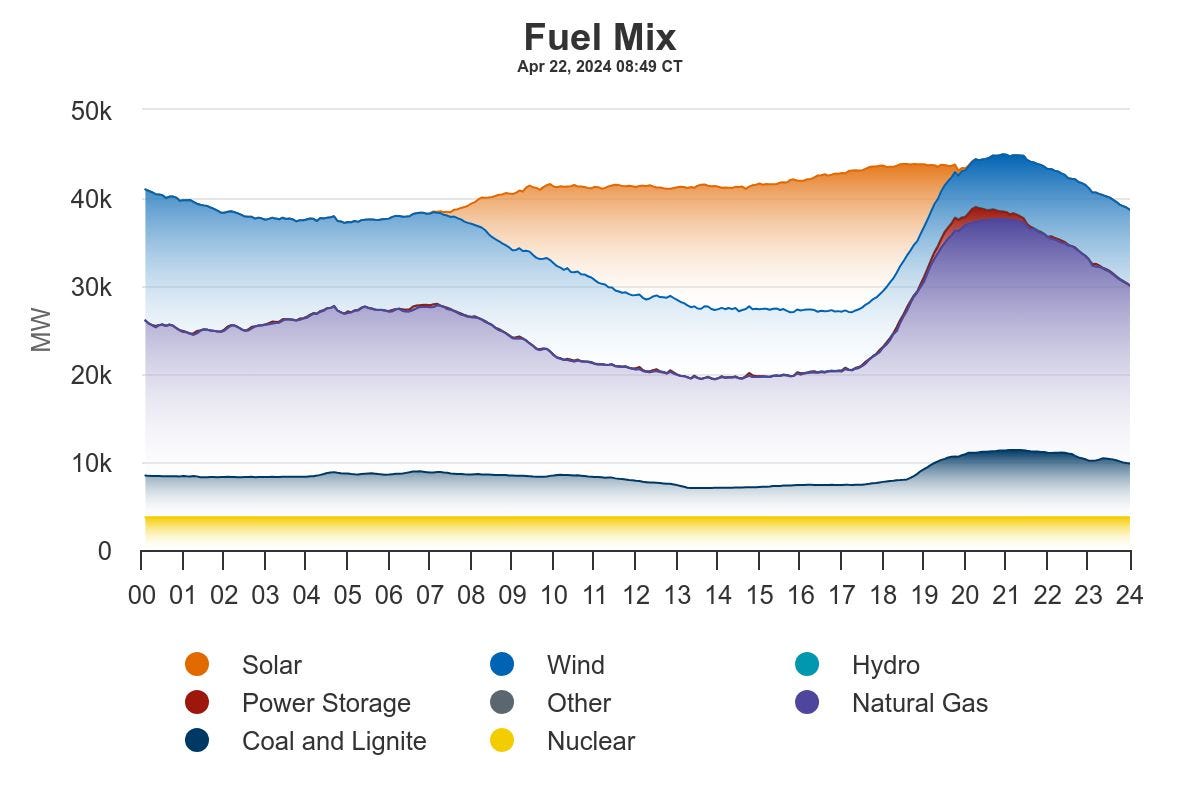
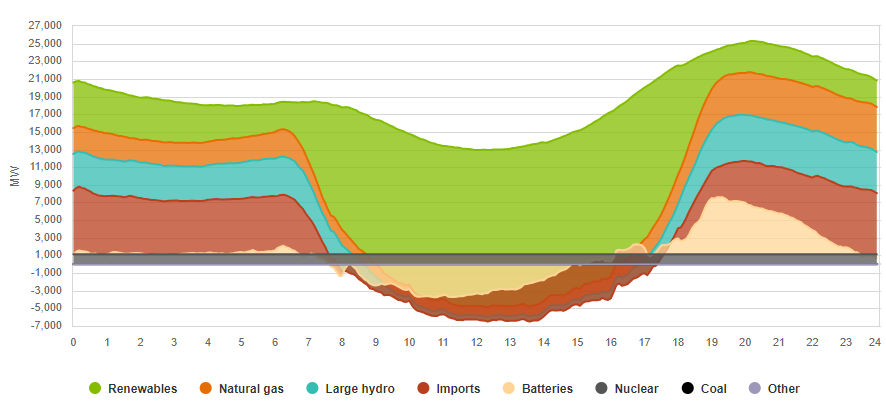
Both have substantial solar generation that warps the supply from other generation types when the sun is up. What is most notable is that batteries are now starting to show up in a real way in both systems. Batteries are now powering the problematic evening hours in CAISO after the sun goes down. In ERCOT, the impact is less but growing. Both of these grids built out their renewables without the presence of batteries and are adding them on now. This is an inefficient way to build, so we should see other markets with less developed renewable portfolios build out batteries in parallel. This is good news for grid resilience as batteries ramp faster, are cheaper, and are more reliable than peaker plants that sit idle most of the year. The opportunities in these markets are in battery build-out and more speculative bets, like geothermal, to provide more clean firm generation.
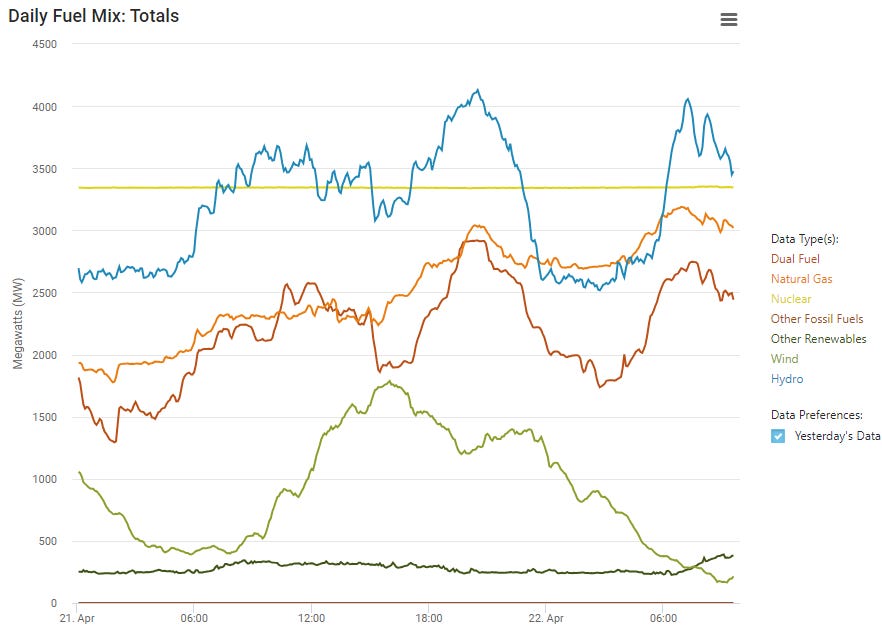
PJM loves gas, nuclear, and coal
The mid-Atlantic US is largely covered by PJM. Its mix is a huge contrast to CAISO and ERCOT. The most densely populated section of the country is almost completely powered by gas, nuclear, and coal. This is not surprising given the proximity of the Marcellus Shale to generate gas and the historically coal-driven Appalachia. PJM’s website focuses on price and load, with only a real-time pie chart to show the generation mix. The same approach is taken by MISO and SPP, two other fossil fuel heavy grids. This approach helps maximize the appearance of solar given most people would be looking at this website while the sun is up. However, I was able to pull the raw data and plot it. PJM has some of the highest opportunities for renewables. This is consistent with the number of proposed offshore wind projects to power the area. Solar isn’t likely to be as big of a factor here as it is in sunnier places with less population density, but it’s still well underbuilt. Interconnection seems to be the blocker to solar at this point.

Windy Midwest is dominated by coal and gas
SPP and MISO cover the windy midwestern states where farmers have embraced onshore wind turbines by leasing their land to wind farm operators who provide the farmers with a steady income in problematic crop years. The trouble is that the region has done little else to move to renewables. Solar is viewed as a bit riskier given the frequent intense thunderstorms that produce hail and tornados in the region. There are relatively few population centers that don’t already have a nuclear power plant nearby, so it is even less likely than in other areas that we would see nuclear investment in this region beyond what MISO already has in Chicago. There just isn’t the return available to warrant that level of investment. More wind and complementary solar with battery storage will be the way forward, but most likely there will need to be significant government incentives to drive the market away from the cheap coal and gas that is sourced nearby.
Note that SPP doesn’t update their fuel type information as quickly as other operators, so what you’re seeing in this chart is only up until the sun went down on April 21.


Northeast’s diversified power supply
ISO-NE (New England) and NYISO (New York) have a similar profile. They are each blessed with a fair amount of hydropower resources and have the most diversified generation profiles in the US. While almost no coal is used in either region, both have substantial (though aging and shrinking) nuclear fleets and use a lot of gas to power their population centers. They also are mixing in solar and wind with some focus on offshore wind starting to come to fruition. This is one of the few places where long-term hydro storage is available, so the renewable opportunities are bigger here than in most other places. However, it’s a cloudy, higher latitude region with a history of turning off nuclear power. The future for the northeast probably looks like Germany today with declining nuclear power, emphasis on wind complementing highly seasonal solar, and hydro or batteries filling the gaps. This region has the longest road ahead for a completely decarbonized grid because offshore wind is expensive now and will be for a decade or more. If they continue to turn off nuclear power plants, gas from the aforementioned Marcellus Shale will continue powering the major population centers in the region. There’s not enough sun to take care of the winter heating needs with cheap solar. In the end, it will be wind or nuclear that needs to drive heat pumps in the winter and either will require significant government backing. This is a market made for only the players with the deepest pockets.

I am considering making prettier and more consistent charts, but only if people like these sorts of data-focused articles. Happy belated Earth Day!